Tom Clougherty has an interesting graph up at the ASI blog, taken from this McKinsey report, of the movement in combined public and private debt for the ten biggest of the world’s developed national economies, from 1990 until now. Follow either of the above two links to get a bigger and more legible version of this graph:
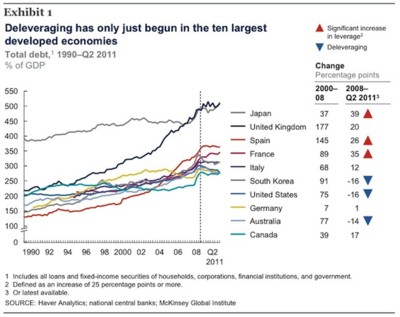
Since 2007, of course, all have lurched upwards from wherever they were to quite a bit more.
To me the interesting bits are those between 1990 and 2007. The general trend was a general increase in debt, from somewhat troubling to somewhat more troubling. But three countries bucked this trend: Japan started very bad and merely stayed very bad; Canada started okay-ish and stayed okay-ish; Britain started okay-ish but became very bad. In terms of the direction things went in, Canada has the best graph of them all, and Britain has the worst. Between them, these three graphs, the grey one along the top (Japan), the green one in the pack towards the bottom (Canada), and the dark one moving most determinedly upwards (Britain), make a kind of big and elongated Z.
One other deviation from the norm worth noting is that just before 2007, Germany, unlike any other country, went (see the yellow graph) definitely downwards. It did what Keynes said, in other words, and paid down its debts when times were good, or at least when they seemed good. In Britain, the “Keynesians”, public and private, just carried on running up more debt.
I know that as a fan of Austrianism I am not supposed to get too excited about national economic aggregates. But this set of aggregates and aggregate movements looks to me quite telling. Make of it all what you will. For me, it confirms the sense that many now have that Tony Blair’s government was one of the worse ones that we’ve ever had.


So it’s all the Germans’ fault, for paying their bills! They started the crash!
What is particularly stricking is that almost all of the curves are flat or trending down since the bump in 2008/2009. So the private sector is at least trying to work through the problem.
In the US, at least (one of the few countries showing an actual downward trend since 2008), all of that deleveraging is being done by the private sector. Government debt continues to increase massively, in both absolute and percentage terms. This graph combines all debt of households, corporations, financial institutions and governments. I’d like to see it dis-aggregated. I’ll bet that would tell a very interesting tale.
Let’s not kid ourselves, Tony Blair might have been at the helm, but it was the economic idiocies of Gordon Brown and certainly his firehosing public sector organizations with money will adding massively inflated off-balance-sheet-items to the national debt that screwed us.
The Conservatives may have invented PFI, but it was Labour that used it to full effect, such that 30-years later we will still be paying the price of the 1997-2010 Labour Government.
If we have ‘done a Greece’ by then of course.
At the risk of “me-too-ing,” what Laird said. There is a HUGE disconnect here between public activity and what the FedGov’s up to. Every single person I know, with the exception of my white-trash relatives (they’re my family, I can lovingly slag them if I want) is looking at debt like it’s finally become an actual “four-letter word.”
For those interested in an examination of fiscal trends and the indicia of the trends of Political Economy, the presentation given by Niall Ferguson on May 13 2010 (that’s right, 20 months ago) at the Peterson Institute for International Economics details (with slides and graphs that are a bit hard to read, but discernable) the encroaching devastation as the obligations for “Debt Service” (basically, interest payments) come to equal (or exceed) 100% of the gross revenues of “developed” nations.
The presentation, with Q&A, is about an hour of video, but is available from the Institute website in audio format too.
I don’t know how to “link” others sites to samizdata.net, so here is the web address for Peterson Institute, and you can easily navigate to the archives and the Niarchos Lecture:
http://www.iie.com
Now, to try to take you a bit closer:
you can add to that address, after “.com”
/events/event_detail.cfm?EventID=152
Good Luck – if you try.
Hey! look at that, the entry does come up as a link !!!
Since I am new at this kind of attempt, let me add a guide to the Peterson archives:
At the top set of tabs on the site is “Events” click
A series of annual dates appears, click on 2010
scroll down to the area of May 2010.
This really is a piece of worthwhile education from a ranking economic historian.
Actually, looking at it some more, I see that Spain has done almost as badly as Britain.
Some of the rise in the UK national debt, according to that chart, happened – at a slower pace – during John Major/Ken Clarke’s tenure, and yet I remember it being a period when the UK’s debt-to-GDP ratio fell, or was at least stable.
J P:
I submit that the ratio of Public (or sovereign?) Debt to GDP is a questionable criterion for these issues of political economy.
If the political forces within an economic unit (a sovereign entity) require the use of credit or borrowing rather than immediate, direct taxation, for the activities (e.g., war) the critical measure becomes the transaction costs of debt, chiefly interest; and thus, the ratio of debt service costs (plus some degree of amotization???) to available (non-destructive) revenue is a better criterion.
There is also the possible distortion in using GDP, which includes expeditures via the sovereign, which may be made with borrowed funds.
An interesting observation, RRS, but I think not entirely persuasive.
First, I don’t know how you define “available (non-destructive) revenue”. Are you talking about the total income of the country? That’s pretty difficult to quantify without significant double-counting. Or are you talking about the amount of the national income which the government could tax away without significant harm to the economy? If so, where’s your Laffer Curve inflection point?
More importantly, in the US anyway, a significant portion (roughly one-third) of total sovereign debt is held by the Federal Reserve. In other words, the Treasury is issuing notes purchased by the central bank. In that situation (a) the debt service cost is a rather meaningless concept, since the government is simply paying itself, and (b) the government isn’t really “borrowing” in any rational sense, but is merely inflating its currency and disguising that fact by denominating it as “debt”. And even where the debt is held by (nominally) private financial institutions, when the government provides a significant amount of their financing at near-zero interest rates, its debt service cost is really just an indirect subsidy to the banks, not a true cost of government.
But I do agree with your last sentence. By definition, GDP includes government spending, which always struck me as a rather bizarre “bootstrapping” sort of calculus. The more the government spends, even on totally wasteful projects financed entirely by inflating the currency, the larger the nation’s GDP? How does such a circular calculation have any meaning?
Oh, and RRS, I forgot to add that even where there is true borrowing by the government you didn’t address the disintermediation (“crowding-out”) effects of that borrowing. Clearly that’s a drag on the economy, but how do you quantify it? It’s one of Bastiat’s “not seens”. This fact alone makes your proffered ratio probably uncalculable, and certainly unusable in practice.
Lots of functions are input to themselves and are not meaningless for it. Any algorithms book will explain to you how to reason about recursion. I’m assuming Economics books teach similar lessons.
I’m not an expert on Economics by any stretch of the imagination, but I think this is the point – or at least on e of the points – of the Keynsian multiplier, and the effect of the multiplier for government spending is generally to show that it’s less efficient than private sector spending. Meaning, in the privacy of his own thoughts, regardless of what he says in the column he writes in his political hack persona – Paul Krugman knows this too, and only believes in massive government spending as a way to get the private sector back on its feet, not as a general prescription.
Someone please correct this if it is wrong.
Joshua, I’m certainly no expert on recursive algorithms, but don’t they generally resolve down to 1 or at least a stabile pattern? The problem I see with the standard GDP calculation is that it resolves to infinity. It’s inherently a tautology.
And I don’t see any parallel with the Keynsian multiplier. That (bogus) idea is that government spending will jumpstart the economy, not that it is the economy. Big difference.
The Blair government was OK for the first two years, during which time it stuck to what the Tories said they would have spent.
Two things happened: 1) Kenneth Clarke (no relation, phew!) admitted he would have racheted up borrowing AFTER the election so the argument for restraint was lost and 2) the Tories demonstrated a total lack of a threat of returning to power. The leftist elements of the Labour party could not be checked by the threat of losing the next election.
That ****wit, G*rd*n Br*wn then proceded to complicate the tax system, borrow according to some spurious “Golden Rule,” selling gold for Uros, etc.
Only good thing: not joining the Uro.
Though I would ask Samizdatistas who supported the liberation of Iraq if the extra war spending was that objectionable since 2001?
Yes, the resolve down to a stable pattern – as, presumably, does the GDP equation. You have a factor in your equation which is dependent to some degree on the output of the previous iteration. So, whatever government spending is going in to GDP this time around depends on what came out of GDP last time around, which has something to do with how much government put in in that (previous) iteration, and so on. But I admit this is a stab in the dark since I’ve never had a class in Economics. The equation is in any case limited by capacity: the government can’t order spending beyond what the nation is capable of producing.
I don’t think the idea that government spending will jumpstart the economy is bogus, not even by Austrian standards. As I understand it, even Austrians agree that government spending is stimulative in the short term. The problem is that easy credit (and of course, also government fiat) leads to malinvestment, which causes problems in the long term. This is actually true for Austrians whether the government is involved or not; the Austrian argument vis-a-vis the government is that getting it involved doesn’t ultimately help anything, and may actually hurt things (by postponing the inevitable recalculation and thereby making it more difficult).
In any case, the reason that government spending is included in GDP is because it’s a blunt measure – GDP’s just meant to be however much economic activity actually happened over a given timeframe. So, if the government hands you $5 and you spend it on coffee, that is economic activity, even if the government invented the $5. Of course, this equation is limited by capacity (even for Keynsians). The government can’t give out more $5 bills than there are cups of coffee without the price of coffee rising. But Keynsians agree here too – after all, the point of monetary stimulus for them is to allow real wages to fall while holding nominal wages steady. So, you get paid what you always did, it just buys less than it used to. You can cover your outstanding debts, you just can’t buy as much.
As for the multiplier, the way I understand they account for this is that the multiplier for government investment is above 1, but is still lower than for private investment. So, say the multiplier for government is 1.1 and for private is 1.4. The economy grows with government spending too, just not as fast as it would have. But 1.1, or even 0.8, is still better than the nothing you get if private investors are reluctant to invest, as in a recession.
I want to stress that I’m not defending this view, I’m just saying that that’s how I understand it. But in any case, the difference between the multiplier for government spending and private spending, plus the limit imposed by capacity, keep this from being a tautology. If Keynsians really believed that government pulling money out of thin air and throwing it at the economy created value, then they would be committed to the absurd position that the only smart investment, really, is in new printing presses. You and I may disagree with them, but many intelligent people are Keynsians, and they plainly do not believe that.
Gee!
I hate to see perspicacity of Laird diverted (if not wasted) into the channels of econometrics, especially when I need to apologize aagin for coming up short on a point.
By non-destructive revenue I mean the extractions from the non governmental activities or (the or is important) assets that will not impair either the functions or demographically required growth of the economy. Many (not Laird, of course) think solely in terms of extractions of “income” (gross or net); but the draw down of labor required to meet rules and regulations can fall in the destructive category – as it did ages back when rents and “taxes” were levied as required labor.
Now, if one goes to the presentation I cited in a preceding post on this comment thread, you will see how apt the ratio I suggested is to the issues involved.
Laird:
On the “inflection” point, the basis for my judgment was set over 60 years ago in listening to a private conversation of my then mentor with Colin Clark (he initiated the statistical concept of “National Income,” which evolved into GDP) who at that time mentioned the study he was doing as to how much of the total national income of a nation could be extracted for governmental (ruling class) purposes for any extended period before causing destructive results. At that time, his historic studies indicated that about 25% was the limit – but the time-line was a variable.
So, my SWAG figure is 25%, the time-line, if the overall transactional level and demographics become static is probably no more than 15 years, provided the extractions go light on assets and labor.
SWAG: Sophisticated Wild Ass Guess.
I don’t know how well this has been pointed out but this set of graphs is for total debt i.e. public and private not public alone. Private debt is not as big a problem as public debt unless you are the debtor (or creditor, for that matter).
I wonder to what extent the UK’s rise is the result of Sarbanes-Oxley which (if memory serves) was passed in the wake of Enron. This led to a lot of business (and presumably debt issuance) moving from New York to London. It’s quite possible that a lot of debt ascribed to the UK is, in fact, entirely American.
Not that it matters much. We’re still in a lot of trouble.
The sovereign debt is segregated in the graphs used in the presentations I cited earlier.
Giving more thought to Laird’s post at 6:35 P M on 1/20:
The purchase of U S sovereign debt by the currency issuing authority (FRS) is monetization of that debt.
The “monetizing” of sovereign debt into “legal tender,” with its inflationary effects as a tax on capital, is an extraction that can be, and has been, destructive. The extent of the destruction and its carry forward in any particular political economy are matters of fairly recent history.
Inflation results in extraction.
Joshua, et al.:
You write of Economic Growth resulting from both governmental expenditures (presumably regardless of the nature and extent of the extractions from the private sector to obtain means for expenditures) and private sector transactions.
In the case of “growth” from Government expenditures what is the nature of that “growth” of the economy and how is it to be measured?
What is your accepted concept of what constitutes economic growth in any political economy?
Again, pleading general ignorance, my understanding is that it’s no different from any other kind of growth. Someone creates value by starting a business that others find useful. As a result of this business and thousands like it, there are more goods and services available at the end of the year than there were at the start. Additionally, existing businesses innovate and get more productive with the same results. Finally, some unprofitable businesses die off, freeing resources to be better allocated. And so on.
I think Keynsians look at recessions as something like economic constipation. The capacity is there, but nothing is moving. People stop spending, but it isn’t as though coffee beans stopped growing, or the factories that make those waxed paper cups shut down, or whatever. Just, people don’t elect to purchase as much of anything, including coffee, as they did previously. So, the government puts money in people’s hands, and they spend it on coffee just as in the past. The coffee shop continues to be profitable, as do the bean farms and cup makers etc. And profits from these businesses get saved and reinvested, blah blah. So, economic growth as a result of monetary stimulus is no different from any other kind of economic growth – with one caveat. I think most Keynsians take government spending to be less efficient than private investment – because it’s just reinforcing existing economic patterns that need to be reallocated. So, usually they give the multiplier from government spending as something a bit less than that for private spending. So, if the economy can function on its own, it should, but if it can’t, the government should step in. Also, handing out money obviously leads to inflation, which is why, in orthodox Keynsianism, you’re supposed to print money during recessions and mop it back up (with high interest rates) during booms.
Actually, in orthodox Keynsianism, it’s really supposed to be fiscal stimulus – i.e. spending on public works projects, etc. You finance this with debt and pay back the debt when tax revenues rise again.
I assume, without really knowing, that they measure this growth as GDP. Which is Laird’s point that part of what they’re measuring is a fudge factor, since they can just set that number at whatever they want. My response is that while it may be a bit of a fudge factor, there’s still a bound. It’s limited by capacity and inflation. The government can’t will more production into existence than is physically possible. If it tries, prices just rise to compensate. Which, if you want to cheat (and governments generally do), you can count as a rise in GDP, but there’s supposed to be a correction for inflation.
I think everyone agrees that GDP is a pretty crude measure, and there are lots of complaints about it. But there’s no consensus on an alternative.
Joshua:
You can’t “plead ignorance,” general or otherwise.
Simply look up the information on how GDP is calculated (there is more than one calculation)
If, after examining GDP you think that is a criterion of “Growth,” since it is based on consumption expenditures, we are in different universes.
Among the similes I might suggest: Chronological aging differs from physical growth. Maturation involves more than aging, though they often correlate. Economic expansion does not confirm economic “Growth.” The fact that a structure is found to support more termites does not mean it is a better structure.
Now, I will give you one in support of your perspective: DARPA.
This is not “my perspective.” It is the Keynesian perspective as I understand it.
Which,obviously, you could also have done yourself, rather than posting the question here as you did. It seems that you are setting people up to defend the Keynesian perspective so that you can then argue against them. I am not your man.
Joshua:
Not at all. I don’t care to contest what are referred to as “keynesianisms.”
Your stated perspective was that government expenditures could generate “growth.” The Expenditures via DARPA have done so – they grew fields of techologies which have enabled more to have more with less effort. That has nothing to do with keynsianisms; unless one focuses only on particular objectives sought through governmental expenditures.
My stated perspective was explaining to Laird that the (Keynsian) idea that including government expenditure in the GDP equation was not a tautology, even if it might be a bit of a fudge. I also plainly stated that I was not defending their views personally, just explaining that they were not inherently contradictory. If you can read that as “my stated perspective,” then I might as well give you my byline and let you type my comments for me.
Joshua:
My apologies.
In using perspective, I did not intend to infer a point of personal intellectual view, though ,of course, it could be read that way.
Max Keiser is a LIAR (I stress the word “liar” because many people, including me, who talk about economics and fianance make mistakes, but Max deliberatly says things he knows not to be true) – however he also has a lot of good information and very great powers of thought.
His prediction is that it will be Britain (not the United States or the Eurozone) where total financial breakdown first occurs.
Graphs like this show why he says that.
And it is worth raising the man’s name (although do not say it three times in a row – as he may appear and he is not nice), as the market people generally are saying Britain is fine – they are falling over themselves to buy British government debt (and so on).
So he will be (justifyably) proud of himself if his prediction comes to pass.
Although I doubt that his laughter will be as lound as the cries of the victims of his master (Putin).
What’s up every one, here every one is sharing these kinds of knowledge, so it’s nice to read this blog, and I used to visit this weblog all the time.
It is the best time to make some plans for the future and it’s time to be happy. I have read this post and if I could I wish to suggest you few interesting things or suggestions. Maybe you can write next articles referring to this article. I wish to read more things about it!