There is little doubt there has been a perceptual disconnect between the reports from the hotel bar in Baghdad and those of virtually everyone else on the scene. The difficulty for someone sitting a long distance away is to judge who really is the more accurate.
Lazarus Long, or more accurately his creator Robert Heinlein, said “If it can’t be expressed in figures, it is not science; it is opinion.”
Earlier this month I decided to take a closer look at the relevant figures. I’ve been tracking the results on a day by day basis ever since. As it is now the end of the month, I am publishing my results.
D.Amon, all rights reserved, may be used with attribution to Samizdata
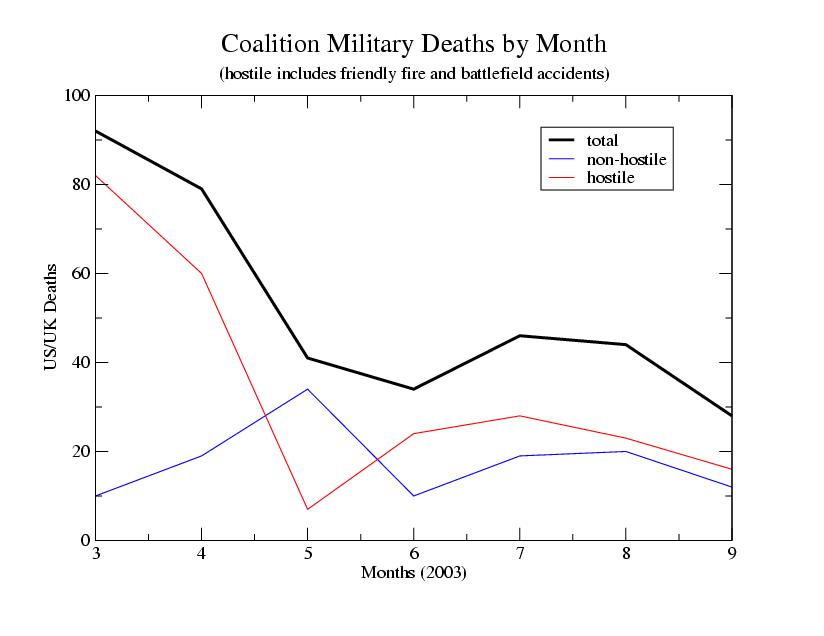
The graph is rather striking in its clarity. There are three phases visible. March and April are quite obviously the period of major combat. The second is May; combat deaths plummet to almost nothing while the accident rates skyrocket. The third period is one of minor combat. Accident rates fall drastically but combat deaths climb to a minor peak before tailing off slowly. At present the combat death rate is running an almost insignificant amount over the accident rate.
My interpretation of the graph is:
- March and April are clearly the period of major combat.
- May is a postcombat month. Remnants of the regime are dispersed and disorganized. There are a lot of dangerous ordinance laying about. Soldiers are tired, ease up slightly and have more accidents because of it.
- June through the present is a period of low intensity conflict. One can read the state of the opposing forces in the short-lived secondary peak followed by a long tail off. That tail-off is their journey into oblivion.
It will be interesting to see if the end comes with a bang or a whimper. One could imagine a last desperate and suicidal offensive by the remaining Saddamites. Alternatively, if Saddam is calling the shots and is taken out of the picture the remnants might just quit and go elsewhere. The most likely scenario – in my opinion – is an exponential tail-off in as the remnant forces are killed or captured


Put a piece of paper up to the screen to block out the first two months and the remaining data points show almost no pattern. I suspect a simple regression would show a slight decrease, though the slope might not be statistically different from zero at a 95% level.
Does that mean “we are losing?” Certainly not. But it says that the present period of “minor conflict” has been going on at a fairly consistent level for five months.
Now there may be a plausible story of change hidden in that “fairly consistent.” One could say that it took a while for the remnants to get it together enough to kill off coalition forces–but they are now being slowly taken out and will eventually “tail off … into oblivion.”
That, in fact, is my opinion. But it is not something that can be proved by the 5 months of data since the end of “major combat operations.”
I beg to differ. The combat fatalities show a very clear pattern from May through September. Whether the long tail off continues at the same rate is of course not certain. But I will stick with my “best guess” that of the possible scenarios it will continue.
The future may be uncertain, but the 6 month pattern is quite clear. Even the slope you mention: from 25 down to 15 in 3 months is nothing to sneeze at and is quite statistically different from a zero slope in my book.
This is great news, but in that last great suicidal spasm, watch for a “Tet”-like offensive. That would be a PR disaster for us, even though we’d most likely dish out far more than what they could deliver. Sorry for the Vietnam analogy; I know they’re not perfect.
I’m with Dale on this one. If you block out March and April you still get the progression he described. But blocking out the first two months is a weird thing to do. After all, it gives context to the increase in accidents and decrease in combat deaths. Why limit your data points? Generally, the more data the better.
It looks promising and definately could be a positive pattern…
but I hate to say it…
“Time will tell” 😀
One thing that I’m interested in is how the data was acquired. I’ve been doing a similar analysis, and I’ve found that it takes a week or so for all casualties to be reported, at least in the list on http://www.defendamerica.mil, which I’ve been using.
At http://tom.idealog.info/files/2003-09/ I have 3 graphs, showing the data at 1 week, 2 week, and 30 day intervals. (Ignore the ticks on the bottom, they’re not accurate. The bars correspond to time periods ending with today.)
One thing I’ve noticed in the few weeks since I started this is that the last bar is always low, since it takes most of a week for the list to be updated.
I think the numbers are decreasing, but making the case with 1-week figures is hard to do.
Dale:
This is great stuff! I hope you bring us monthly updates. Do you have a summary table of the data points of your graph? I’d like to use this as an example of testing for trend in a couple of the undergraduate statistics courses I teach. (Of course, I’ll report back with any clear correlations…)
Dale, if you’re feeling industrious enough, and the data sources are sufficiently granular to do it, you might try updating weekly rather than monthly. If the data is too “bursty” (… pausing for a moment of grim reflection on what that means in human terms …) you could do a four-week trailing average. Trends might emerge a little more clearly then.
Of course, you’re providing a valuable service by gathering and presenting the data in the first place. I realize it’s free ice cream, and don’t wish to appear ungrateful by asking for more, in a slightly different flavor…
The Washington Post from time to time publishes a graph of deaths by day, going back to May 1. It appears to show that the death rate peaked with a cluster in the week following the Uday/Qusay deaths. Since then, American deaths are down 30-40%, with intervals as long as 8 days between deaths.
Would you be able to do us all a favour and include a couple more sets of data points covering the same period of time.
First, reduce the data you have to deaths per 100K.
Now, compare them to accidental deaths and homicides per 100K population (18 to 30 yr old males) for Washington DC and another major US city, say Los Angeles.
Better yet, after that clean them up a bunch and use the DC data as the reference. Express Iraq data as a decimal percentage of the DC rate.
I personally suspect that most areas of Iraq will be functioning smoothly and safely before most areas of DC are.
The data is not a direct measurement of how well we’re doing; pace Lazarus, qualitative “opinion” is important. The body counts in Vietnam weren’t a measure of how well we were doing; that is inherently a more nebulous concept.
Part of the dropoff is probably the result of decreased exposure of US troops as Iraqis take over more security functions. There are fewer US troops standing around in exposed places were it’s easy to pop them. My impression is that the volume of attacks has dropped off somewhat; figures I’ve read have described it as going from something like 25 incidents per day to about 15 incidents per day. But the effectiveness of the attacks that are done has picked up somewhat, as the attackers move from dumb RPG or AK attacks to remote detonated munitions, or, in the last few days, mortar attacks that are more accurate than usual. The surviving attackers have managed to learn something and are better at it.
I suspect that the number of attacks will be at a noticable level until Iraqi security forces get online in a serious way. The militia forces have inherent advantages in language and culture and should therefore have better intelligence. Roughly somewhere around the new year is my best guess for knowing whether the attacks will be broken or not.
Excellent, and I think many readers have been noodling a similar concept in their heads for some time. Of even more interest to me would be a chart showing hostile actions — this one showing casualties would be even more enlightening when combined with such a chart.
I think Dale’s basic analysis is quite persuasive, and intuitive. To add some additional qualitative color to his analysis of the 3 phases, I’d say the “decline towards oblivion” clearly reflects the adaptation of coalition forces to enemy tactics, and the attrition/disruption of enemy capabilities.
I also think a chart of this sort actually understates coalition progress and advantages. That’s because there is such a low level of enemy activity. Many days pass without any wounded or killed coalition personnel. Then, with bad luck, a car bomb might kill 10 in a single day. This is as likely to reflect the diminution of enemy capability (they now can use only terrorist-type methods, even quasi-military attacks are infeasible for them) as anything else. Yet it will show up as a spike on this sort of data.
Among the worst failures of the truly poor reporting coming out of Iraq, the near total absence of any serious military reporting is notable. All we get are snippets with bare details. One has to read very carefully to find nuggets giving any general sense of the picture — but when one does, it comports with the chart.
I believe Gen. Sanchez said not long ago that coalition forces weren’t threatened by any resistance “tactically, strategically, or regionally.” It would be nice if they did some briefings to remind everyone just how geographically limited, militarily ineffective, and politically isolated the “resistance” is.
Gen. Sanchez remarked that with good intelligence, he could finish his job with “one platoon” of his forces. Gen. Mattis (USMC) recently noted that it was fairly easy to destroy the enemy once they were found. In the last 30 years US military commanders have become extremely circumspect about such statements — so I took these two comments to be quite significant. Even the media knows that while these sorts of statements at the Rex Hotel in Saigon would have been highly suspect, in Baghdad they’re very plausible.
There may be a Tet like offensive, but only in the sense that the remaining Saddamites hit simultaneously across the country with a concentrated attack in one city.
During Tet, this was Hue, a Vietnamese city of cultural and dynastic importance and one where there was some hope of successfully taking the city and holding it for at least a short time. This would have been a political victory. Tet failed and the Viet Cong were nearly wiped out. The rest of the war was mostly fought by North Vietnamese regulars.
The factors that made the Tet offensive militarily feasible simply aren’t present in Iraq. There are no staging areas and no significant logistical support from the outside for any analogous buildup of force sufficient for even a local advantage. The Saddamites would need to make do with what they have. There could be some wide spread attacks and a coordinated attack on posts in a city in the Sunni triangle, but there is no chance for even short term success. There’s no North Vietnam to continue low intensity conflict and ramp up.
There might be some short term political advantage. After Tet, the inaccurate perception was that the US was badly bloodied and the political victory was handed off to North Vietnam anyway. That won’t happen here. The growing unease with media’s veracity concerning Iraq that wasn’t present during Vietnam would place any media reports of defeat in question long enough for the obvious US victory to overcome the meme before it started.
The smart money here is that the attacks will continue to taper off as the combatants are killed or captured and the the supplies depleted, or Saddam is captured/killed and the combatants disperse.
Gary,
Great post. I hope you’re right.
It would be easy to over-interpret this data. There can’t be any doubt that the decline in the death rate is good news, and it’s probably only appropriate to see it as that, rather than a harbinger of things to come. We are in a war, and the enemy does not yet appear to be defeated. They will attempet other tactics and strategies, so what we know for certain is that we’re getting the better of them at the moment.
But one piece of information that seems fairly important is whether or not the attackers are all just disgruntled Saddamites, or Sunnis who aren’t necessarily pro-Saddam but might be anti-US for one reason or another. Or they may just be fearful about their declining influence and fear the Americans are pro-Shia.
I heard a radio show done by Minnesota Public Broadcasting on the situation in part of the Sunni Triangle, and it would appear that we had some really bad planning, and have a steep learning curve. And our forces there aren’t terribly keen on switching to the nation-building mission. I don’t know how seriously to take this stuff, but if there’s truth to it we’re still pretty far from being able to pat ourselves on the back just yet. And the RAND report is pretty explicit that the successful nation-building exercises began with much higher troop concentrations and more money than we’ve committed to Iraq.
I’m a cheerleader for our efforts there, but I wish I could say I made sense out of the details of our strategy and tactics. Anyway, looks like good news since July or so, huh? I figured awhile back that the combat deaths since the end of “active hostilities” are still lower than the fatalities incurred during the construction of the Alcan highway, which gives a little perspective.
–Scott
Interesting, but this tells us little. You cannot keep score in war, like a football game.
This is the kind of one-dimensional analysis unsuited to the complexities of war, esp. 4th generation war.
Coalition fatalities appear to have stabilized at about 1 per day, down from July at 1 1/2. Why?
Most obviously, the opposition (whoever they are) has widened the scope of their attacks to include Iraq government officials, police, UN, and vital infrastructure.
Perhaps we are patrolling less aggressively, relying more on fixed, secure positions.
Also, some reports indicate that Coalition forces have pulled back from “hot spots” — if true, a very bad sign.
For expert analysis read some of Lind’s articles on military.com. Also see the 9/22 Iraq Status Report on http://www.d-n-i.net (this also has some useful links to sites tracking Coalition and civilian deaths.)
What I find interesting is in month number 5 the is a huge swing in the ‘type’ of death al of a sudden we have 40 or so non-hostile deaths. and only 5 hostile deaths. I think the military or more likely the administration have been and still are fudging with the numbers.
How many ‘traffic accidents’ do the have in Iraq. So I think your little chart does little to prove your position. It looks to me like we are hovering in a 10 person swing. 35-45 brave souls a month.
Do it matter that there are non-hostile deaths? I wonder if the families of the so called non-hostiles get the same benifets as the others?
What ever why the hell am I wasting my time here
you don’t care about these men and women your just looking for a talking point so you can justifie your failed position. Have fun!!! Good luck
your going to need it.
Blocking off the first two months, we have (by my figures, which look pretty close) an average of 39 per month. Our null hypothesis must be that these deaths are randomly distributed, in which case we would have a standard deviation of 6.25, or a standard error (95% confidence) of 10.3.
There is no month which is significantly different from 39 +/- 10.3. We therefore cannot claim that we have evidence for any non-random effect.
(Perhaps the S-value would be a better measure? But I doubt you’ll get a different result. Graphics can be misleading, especially when you leave the error bars off.)
Very interesting. Adding a graph line of the deaths of youths between 18 and 25 or so in the New York City or Washington DC areas would probably show an interesting comparison. My guess is that the death rates in these cities would prove higher, even when corrected to deaths per 100,000 citizens in the age group.
The use of troops in offensive situations has actually picked up a bit. When the US was providing all security in Iraq you needed a bunch of troops standing around outside of banks and on street corners, where they were subject to low-tech attacks by bozos with AKs. As the Iraqi security services have picked up the US troops have been able to deploy to other sorts of things.
The appropriate tactics to use are tricky; sometimes it may be appropriate to “pull back”. Sometimes the big army approach of conducting raids is not the right thing to do, and the special forces or USMC-style combined action platoons is better. I’ll defer to the people on the spot about appropriate tactics for now.
Is it possible to compare current data on Coalition casualties with equivalent data from Germany in the months following WWII? As I recall, guerrilla activity by holdout Nazi groups such as the “Werewolves” resulted in a steady toll of post-war allied casualties.
But I don’t recall any anguished calls for withdrawal, any accusations of poor intelligance or a lack of post-war planning. And none of the Great Souls of our media mocked our attempts at nation buiilding.
I also recall that – despite these losses – nation building and democratization reached the point where Germany – though bombed into rubble – became both a major economic competitor, and a major NATO ally.
> Is it possible to compare current data on
> Coalition casualties with equivalent data from
> Germany in the months following WWII? As I
> recall, guerrilla activity by holdout Nazi groups
> such as the “Werewolves” resulted in a steady
> toll of post-war allied casualties.
It’s basically a myth, it seems.
—
A Slate article [ http://slate.msn.com/id/2087768/ ] states that “while there were the occasional anti-occupation leaflets and graffiti, the GIs had reason to feel safe. When an officer in Hesse was asked to investigate rumors that troops were being attacked and castrated, he reported back that there had not been a single attack against an American soldier in four months of occupation. As the distinguished German historian Golo Mann summed it up in The History of Germany Since 1789, “The [Germans’] readiness to work with the victors, to carry out their orders, to accept their advice and their help was genuine; of the resistance which the Allies had expected in the way of ‘werewolf’ units and nocturnal guerrilla activities, there was no sign. …”
—
James Dobbins’ “America’s Role in Nation-Building: From Germany to Iraq” [ http://www.rand.org/publications/MR/MR1753/ ] also supports this view. I find it quite interesting that post-WW II Germany undoubtedly was more devastated, had millions of refugees from other countries etc. etc. yet there appears to have been far less resistance to the U.S. occupying force than in today’s Iraq!
—
Re. Dale’s original post, I think the only safe bet is to continue expecting the unexpected… There have been several surprises in Iraq during the past twelve months.
MARCU$
Pathetic. You really are desperate.
Marcus,
The lower level of guerilla activity following WWII in Germany was probably due to two factors: 1) As you correctly observe the country had been heavily bombed, and most people were completely fed up with the government and happy to see the Americans come in, and 2) there wasn’t another Nazi country next door shuttling people in to cause trouble. Syria is still run by Baathists.
Now does this mean we should have firebombed major Iraqi cities for six months before rolling in? I’d say no, but if one follows many of the arguments coming out of the liberals to their logical conclusions, that is where you end up.
-S
A few persons asked about the data. Full data records on each casualty are available at the site linked to from the article.
As to statistical analysis. The raw datapoints are not independant. Deaths are caused by organized small unit warfare and possibly with a smaller number of random events.
If Iraqi forces are taking on the burden (which they have only just begun to do) that is fine but is outside the data of this graph, which pertains only to US forces v Saddam et al. It is, after all, the point of things to let them take over and do their own fighting.
Hey Dale, great job. I, too, would like weeks rather than months. Also, a similar graph on “attacks” which caused deaths; or at least having one recorded hospitalization.
I think #of “successful” attacks is, in many ways, more indicative than the absolute numbers killed (with unspecified qualitative threshold effects; the difference between the first WT bombs; the Okla. bombing; the WTC attack).
In any case, there really are TOO FEW (American) deaths to make big claims — and that’s the great news. Add all friendlies (um, I guess the UN is friendly?), and the numbers get a bit bigger.
It would be really nice to include Iraqi deaths, maybe in another chart, but it’s likely too difficult to get numbers, and there’s the huge problem of friendly neutral enemy.
But I really care about them, too — and those suffering Iraqis are one reason to support the liberation. And when any die, from other terrorists or from coalition mistakes or collateral damage, those are tragic deaths. Riverbend keeps reminding us of this, with reasonable passion.
Tom:
Those would all be good items for study. The difficulty is finding good data. For US casualties there is an indisputable time series and accurate data. American families would not take kindly to having their loved ones vanish without any report of status or to be reported on incorrectly. I recognized there would be some heat on this so I stuck to an easily defensible data set. If anyone doesn’t like it, they can go to the site linked from the story and they can see the raw data for themselves, complete with name, rank, home town and cause of death.
I have no way to get that information for the Iraqi’s or other any other civilians, nor for numbering attacks. Any means by which I collect the data will be open to attacks on accuracy and completeness for which I simply do not have the time to deal with. I survive (quite barely I might add) as an independant consultant and keeping up with my trade takes more hours than the Earth’s rotational velocity put in the day.
I might well look at doing a different binning; there might be enough data for a week bin size, although the combat fatality rate is getting so low that we’ll just see a lot of noise at the level I fear.
Great to see some numbers. Your readers might be interested to see how the death rate compares with the accidental death rate in civilian heavy industry.
Broadly, based on 145,000 US troops plus 10,000 Brits, and using your excellent graph, the death rate is running at around 150 per 100 million man-hours of exposure.
Accidental death rates in the best of developed-world industry are in the region 4-6 (eg agriculture, construction, oil). We can only guess at the worst in the developed-world since they never publish, but a factor ten worse would not be unreasonable based on other accident observations. Industry in the developing-world industry is even more accident-prone.
It’s probable therefore that the military death-rate in Iraq is in a similar order as heavy industry in the developing-world (think coal-mining in China or construction in India).
Grim but not irredeemable.
The amazing thing is not the trend but the extraordinarily low totals overall.
Is there any precedent in history for a ruthless and (apparently) powerful police state being utterly overthrown at such a miniscule military cost?
Astonishing.
Dale, Kevin, Tom:
Agree with the idea of binning the data by week, if only to avoid the 28-29-30-31-day mess that comes with months (extra data points help for correlation, too).
Ernst, Scott, Larry:
Certainly it’s easy to read too much into a single graph, but it’s just as important that someone make the graph and look for trends–especially if it starts swinging back UP. Solid quantitative data help keep everyone honest.
A Friend:
The US CDC and NHTSC track death rates as a first step in trying to reduce them. I see more pathos in a teen-ager dying in a careless auto crash than in any combat casualty.
Bart, David, SlimJim:
Hey! Don’t let Dale have all the fun! The rest of us can google up data as well as he can.
Incidentally, some people prefer the cumulative death toll graph Integral(f(t)dt) instead of the straight f(t) as I have done. I initially rejected the other approach as being unformative, but as I think about it, there may be a key bit of information in the integral curve. I think we’ll see a rough exponential curve in it, and from that one can calculate an approximate asymptote. If one assumes a battlefield condition in which the enemy is not heavily reinforced and supported and that trends consider as at present (I am fully aware of the Yogi Berra quote!) then the asymptote gives you a rough final US/UK death toll.
Basically we just have to wait and see what the data tells us when it comes in.
The graph is very revealing. in that American deaths are definitely tailing off with the passage of time.
I have noticed that almost all press reports available to me report on current deaths and then follow that report with a rehash of 2-3 or more similar attacks/deaths from several months prior. In other words the press, in its’ institutional bias and determination to mark this war as a failure, now has to pad current death reports with others (previously reported) to keep the impression of tragic misadventure alive. If reports focused on current deaths only there would be a longer and longer time between said reports. Some good news might sneak in to the gaps, like weeds in the bare spots of a lawn. Can’t have that can we?
> The lower level of guerilla activity following WWII
> in Germany was probably due to two factors: 1)
> As you correctly observe the country had been
> heavily bombed, and most people were
> completely fed up with the government and
> happy to see the Americans come in,
…in part because West German war refugees were acutely aware of what the Soviets were doing in the East.
> and 2) there wasn’t another Nazi country next
> door shuttling people in to cause trouble. Syria is
> still run by Baathists.
Indeed. I don’t think Arab nationalism/Islamic fundamentalism has been significantly “discredited” by the military setbacks — or even by Saddam’s excesses. If you check opinion polls from Iraq, it seems the local population remains very ambivalent about Westerners occupying their country.
> Now does this mean we should have firebombed
> major Iraqi cities for six months before rolling
> in? I’d say no, but if one follows many of the
> arguments coming out of the liberals to their
> logical conclusions, that is where you end up.
You are setting up a strawman argument. Nazism and WW II fascism in general wasn’t a *religion*. Islam is, and it promises eternal life in paradise for its martyrs regardless of the pain and suffering its followers may have to endure here on Earth.
That is why Islamism may not be discredited by economic/military failure to the same extent as fascism and communism were. Now, the “idealists” believe Arabs are just as likely to embrace capitali$m and democracy as anybody else once they are exposed to our secular ideas and standard of living. If this were true, how come democracy has never gained a foothold in the Middle East despite millions of Arabs living in Britain, France and other European nations, or satellite TV from across the Mediterranean?
MARCU$
I believe it was General Patton who said (paraphrasing from memory here) — “I like it when the enemy shoots at us. That way we know where the bastards are and can kill them.”
There’s a couple problems as I see it. The first, while deaths may have decreased, what about casualties. Modern medicine and body armor probably are as much to thank for the decrease in the death rate as anything else.
Second, this might not be a real great measure of success. If not for any other reason than the fact that there has been an escalation in the number of attacks on purely Iraqi targets and non-coalition sites.
Finally, to the person who suggested that there should be a graph to compare the above death rate to the homicide rate of Washington, DC. You have no grasp of statistics at all. If anything, you would be better to compare the death rates of Washington DC police officers to the troop casualty rate. Again, if you compare the homicide rates, you’d need to add back ALL the civilian losses. I would imagine that the picture you would get is a particularily happy one.
I specifically used death rates instead of casualty rates (dead + wounded) because it better shows enemy effectiveness in attacking coalition forces and because I simply did not have the time to do both. Also, there should be (but I will not guarantee it) a fairly constant ratio between dead and wounded. I might also do that graph at some point if time allows.
There are an infinitude of quantities that can be graphed and ways in which they can be correlated. I chose the absolute simplest and most basic number.
Another person noted the problem of variation of days in the month between 30 and 31 over the period. I don’t think that will have had a very large effect although it is a valid point.
Statistical arguments become meaningless when the arguer choses his data points to pick his preconceptions. Roger may know a smattering, or more for all I know, of statistics, but his instinct to choose data to fit his beliefs far outweighs his technical knowledge.
Another common example of this technique used by lefties is the time spans chosen to “prove” global warming. They almost always choose the coldest available period in the data as a starting point, the 1960s or 1917 (the coldest year on record, but not the first), and never pick a warm point, such as the thirties which were as warm as recent years. When I see such tactics used in argument, I automatically assume dishonesty. You should too.
David Gutmann attempts to make a popular correlation, namely that Iraq should be compared to Germany (Japan is usualy used as well). We are fighting a great scourge. Patience is required. Why is the media so unsympathetic to the cause. etc…
The correlation errs on two accounts in my calculations. Firstly, Germany scarred everyone geo-politically as they were at the forefront of a powerful, new and dangerous political movement which we sought to decapitate, namely Fascism. Iraq scarred no-one, barring perhaps the Israelis, and they were not at the forfront of the Islamic extremism which is our enemy here. Ba’athists were socialists, not such a friendly bunch, minus cynical political maneuvering, with the religiously inclined.
Secondly, and more importantly in my book, Germany and Japan were already industrial giants. Though their factorys were bombed out, the intellectual and physical capital was there to jumpstart the economy, along with a healthy demand market. Iraq’s infrastructure is a joke. Beyond oil it has no industry to speak of, nor much domestic demand. This is not to say that all attempts to create a dynamic economy will fail there, but any chace of success is going to take serious time and serious money. Do we have either?
Dale: You say, “The combat fatalities show a very clear pattern from May through September.” Indeed, they do. There is a sharp increase May to July and a gradual decrease July to September, with September combat deaths higher than in May but lower than in June.
One can come up with any number of explanations for that pattern, some “winning,” some “losing,” and some “agnostic.” All I was trying to say was that the data does not scientifically prove that combat deaths are going down and will continue to go down.
There is, as Hayek has pointed out, science and there is scientism. The former is humble and aware of its limitations. I was preaching humility. (One of my limitations is laziness, so let me say thank you for tracking down the figures, graphing them, and putting them up where everyone can see them. That IS science.)
Veeshir: I don’t think you should throw out the first two data points. They do indeed provide context. But you shouldn’t use them when they aren’t appropriate either. If you are asking the question, “Are postwar attacks on coalition forces going down?,” then you don’t use wartime figures.
> Statistical arguments become meaningless when
> the arguer choses his data points to pick his
> preconceptions.
Really, there is little difference between pro-war people citing the slight drop in combat casualties during the past two months, and “quagmirists” doing the same thing based on two months’ worth of data in May-July.
—
My bet is the monthly casualty rate will remain approximately unchanged half a year from now, i.e. 20-30 deaths. It’s just a guess, but it seems like a good bet when one considers the history of past occupation efforts in Beirut and the Palestinian territories.
MARCU$
The combat death rate is already lower than that. I suspect it will hit a steady state at 5-10 month before troop pullouts begin. The accidental death rate may also go down a bit but probably not by much. It may be more dangerous to drive in Basra than to patrol in Tikrit.
Also, regardless of what the DOD refuses to say, I think we’ll see a significant reduction in US troops before a year has passed. I think Iraqi forces will be doing most of the work by next summer.
Excellent!
Now do a cost comparison between remaining in South Korea (six decades of no results that’s a quagmire!) and remaining in Iraq. Then compare the cost of Iraq to Kosovo. (why are we still in Kosovo?)
Then compare our casualty rates in Iraq to our casualty rates in Washington D.C.
News media are treating Iraq news like US local news: “If it bleeds, it leads.” What impression would foreigners get of, say, Chicago, if they only watched the 6pm local news? Murders, car crashes, corruption… Today’s 15-second Iraq report on the radio was about Iraqi police breaking up a “riot” of people protesting unemployment. That’s until another soldier dies.
> Then compare the cost of Iraq to Kosovo. (why
> are we still in Kosovo?
Kosovo? Do you really want to compare Kosovo & Iraq? The cost to U.S. taxpayers is just a tiny fraction of the Iraqi occupation, in part because other countries are footing most of the bills. U.S. peacekeeping forces have had almost no combat casualties in Kosovo, as far as I know.
MARCU$
Terrific graph, thank you!
Been doing my own close calculations. Our worst month post Baghdad Liberation Day was July – during major aggressive ops where we took out some serious enemies, their $$$ and weapons – and following the death of the two Hussein “boys” – the revenge of the Big Bad Ba’athists” – a lowlife who tossed a grenade at a children’s hospital killing 4 of our heroes (now in our custody!).
For the entire month of July, we lost 28 total troops to hostile acts across a nation the size of California, with ~ 150,000 US troops on the ground at the time.
Quagmire? Nonsense! It’s a non-bloody miracle! Has been from day one of the war.
Our FREE (thanks to the troops) American press is THE biggest scandal of my lifetime. Clinton’s impeachment, Watergate’s nothing compared to our left-press intentionally misreporting the war, undermining our efforts in Iraq, selling out the troops, the free world and America – aligning themselves with pro-UN global socialists for personal power’s sake during wartime – post 911.
One comment wondered whether fewer deaths was linked to some sort of less aggressive posture by coalition forces — afraid not. The posture has been very aggressive, at times even provocative, with the precise purpose of drawing out the enemy. That’s why there have been, since April, hardly any attacks on coalition base areas, and almost all reported actions are ambushes.
In Fallujah there was a decision to withdraw to the town outskirts instead of maintaining a large provocative presence. Local tactical judgements in different places will vary, but the overall aggressive posture won’t, for the simple reason that we’re up against a very small opponent with very limited capabilities, no meaningful outside life-line, and questionable political base even in its heartland (and that “heartland” runs the real risk of being marginalized as the rest of the country begins to come back to life).
Other than the language being Arabic I can’t see any similarities to Lebanon, suggested by one comment — unless one puts coalition forces in the role of Syrian forces, which come to think of it HAVE achieved their occupation objectives in Lebanon with minimal casualties.
One key consideration in Iraq is that the base of our natural adversaries — the Sunni Arabs of north-central Iraq — are vastly outnumbered, distrusted and often hated by other Iraqis, and without oil resources, whereas the other large groups (Shi’a and Kurds) are mostly cooperative, very anti-Ba’ath, and have got the oil. The correlation of forces, to borrow a klunky old Soviet phrase, is not promising for the bad guys, to say the least.
The chart is meaningless. During the same period scores of Iraqi police (you know, our allies?) have been shot, blown up by car bombs, or otherwise assassinated, but somehow they don’t figure in the chart of “coalition” casualties. Why? Their deaths don’t count for as much as American ones?
It does help a bit if you read the discussion. 1) I do not have accurate or trustworthy data on Iraqi casualties; 2) It is not relevant to the question at hand: are media reports about coalition casualties overblown?
Iraqi’s live there. They don’t get to go home and forget about it. They will possibly be fighting a low level terrorist threat for years to come. I do not denigrate their fight for the own freedom and would like to see it turned over to them as soon as they tell us they are ready.
> Kosovo? Do you really want to compare Kosovo & Iraq? The cost to U.S. taxpayers is just a tiny fraction of the Iraqi occupation
If you consider $14 billion in military costs and $7 billion in humanitarian costs `a small fraction’ of Iraq’s then you need to cut down on whatever you are smoking.
Sources:
GAO
– FY 1998
– FY 1999
– Kosovo Supplement 1999
– FY 2000
– FY2001
– FY 2002
– FY 2003
http://www.fas.org
NY times search, keyword Kosovo
Thanks for the methodology !
I’ve found similar conclusions on a site related to the Swiss Army , very reliable by any standard .
see :
http://www.checkpoint-online.ch/CheckPoint/Monde/Mon0068-IrakSituation.html
The site is in French but understandable with very good analysis of the War in Irak and other issues .
Listing daily losses without explanation does not help to understand a situation , much less it’s trend ! The European medias are condemning themselves to total misunderstanding and even disinformation of the situation in Irak …..
> If you consider $14 billion in military costs and
> $7 billion in humanitarian costs `a small fraction’
> of Iraq’s then you need to cut down on whatever
> you are smoking.
So we are talking about ~$20 billion over five years versus HUNDREDS of billions! Thank you for proving my point.
Perhaps you’d care to list the number of American and British casualties in Kosovo as well?
MARCU$
I believe the military costs (SO FAR) in Iraq are something like $20 billion with another $5 billion in humanitarian aid. Not counting the asked for $78 billion in future costs for rebuilding, aid and occupation over the next two years. – Asked for being the key words there
When you start including foreign aid to Albania, Bosnia, Serbia, Croatia and the rest of Eastern Europe. The “asked for” totals in Iraq and the REAL totals of Kosovo start to look remarkably similar.
As far as US casualties in Kosovo/Bosnia/Serbia… Something like 150 (including accidents) VS 320 (including accidents) in Iraq.
Considering the volumes of propaganda being generated over Iraq, maybe Kosovo and the combat conditions in D.C. are a little under reported. 😀
>It does help a bit if you read the discussion. 1) I >do not have accurate or trustworthy data on Iraqi >casualties; 2) It is not relevant to the question at >hand: are media reports about coalition casualties >overblown?
1. If you don’t have accurate data on Iraqi police casualties (an important component, according to CENTCOM, of the coalition security effort), then it is simply not possible to discern any sort of trend. After all, if these Iraqi police weren’t there taking bullets, chances are US troops would be taking bullets in their place. It’s like the final stages of the Vietnam War, specifically the “Vietnamization” whose goal was to reduce the number of US casualties. It worked, alright, but the war was lost anyway.
2. How is it not relevant? Iraqi police are part of the coalition security effort. They are taking casualties. If you don’t have data on these casualties, how can you say the media are blowing it out of proportion? Wouldn’t you first have to prove that Iraqi police casualties have been on the wane, too? And what if they are on the increase?
Also, FYI, there have already been Ukrainian and Danish fatalities, which are also conspicuously missing from your chart.
We are winning >>> best laughable joke ever !!!
We are whining would be more appropriate.
You resort to anything desperate to camouflage your astounding failure doubled by your predictable departure from Iraq.
I’d laugh if it wasn’t so serious…
Do you know la méthode Coué? That was a perfect example of it…
http://news.morningstar.com/news/DJ/M10/D01/1065037862701.html
>>your predictable departure from Iraq.
I’m guessing that you won’t see a US departure from Iraq until they have stable self rule and a working infrastructure.
But hey, that’s just my guess.
BTW: your petulant BS gives me great satisfaction. Continue please!
Please, the Americans are going to be there for the next 40 years just like Japan and Germany…and that’s what the majority of Iraqia want.
To be precise, there are 3 deaths in the other category and they are included in the raw the data.
You should allways take statistics with a grain of salt or two.
Statistics are meaningless in this particular case because the process they are supposed to describe isn’t some mechanical, tecnical, regular process, governed by a set of definite rules we are trying to discover or describe. War is a random, unpredictable and irregular process, not given to description by statistics. War is more like art than science or statistics. War is also not linear: you can be having low losses for a long period, then you go to the offensive, sustain losses but end the war.
The graph is informative about what happened until now, as such it is interesting and good.
What will happen in the future? We can only guess, the graph isn’t helpful. My guess is that, with Syria and Iran around – the low intensity terrorism will not end. It might increase. Syria and Iraq were in shock too from the swift American victory. It might take them time to organize a full scale terror operation. If the US is serious about stabilizing Iraq and the ME it will need to do something about Syria, Iran and possibly Saudia. Not very probable I think. The more probable outcome: at some point, after administration change, the US declares victory and retreats, and the ME stays the way it allways was. But that is a wild guess. If there is another terrorist blow in the US all bets are off.
One metric that may be worth tracking is the number of Iraqis who have been killed by the Islamist and Saddamite bands. No doubt those numbers will continue to rise in the short term, especially since their favourite tactic is now to use bombs.
It would put lie to the claims that they are a genuine “resistance” movement.
You gotta be kidding me. You can’t do any meaningful analysis on that data. If you look at the graph of a stock price, you can’t predict what it’ll do based on the graph alone. You have to look at the company and the economy it’s in. The chart follows reality, not determines it.
The Map Is Not The Territory.
This is the difference between number theory and numerology.
Great effort, but the most comprehensive causalty count, based on multiple sources, that I have come across is the Iraq Coalition Count (http://lunaville.org/warcasualties/Summary.aspx).
I would suggest you use that data to plot your graph, since each instance is backed up with multiple citations.
I guess Anthony didn’t check the link on the article…
Stock prices are not comparable to war casualties. Now perhaps if Saddam put up an exchange and made a market of bids for killing Coalition soldiers with puts and places and the like… then we’d get some random behavior.
I will also note that if you go back to the article I enumerate several scenarios and say which one I (and many others) think is the likeliest ending.
Perhaps sometime next summer I should come back to this and toss in the face of certain folks… but they’ll all be off on a different “failure” by then.
I think some folk should also take on board that I did not spend time analyzing the data and deciding what outcome I wanted. I decided on the format first, then put the data in. Had the trends been rising, I would have published and said so and probably gotten even more publicity by backing up the media line.
Those are the numbers. If you don’t like them… tough.
Hmmm… I was rather rushed on that. Please note that only the first line relates to Tony, the rest of the messages is to someone else.
Bob Ascii: Continue please!
At your service, Bob!
Rumsfeld & Co are deliberately lying about the far-reaching consequences brought about by their utter incompetence in each of both, planning operations & defining strategic goals.
So far, 6.000 US soldiers have been evacuated from Iraq out of medical reasons (not the flu), including 1.500 seriously injured. You may launch investigations either in Germany transit camps or at Andrews base.
Dead are officially reckoned by US myth factory to be 140 approximatively (from May 2003 on).
Jacob: I agree with you, once in a lifetime!
The way the US is handling asymmetry is flawed & poorly implemented.
FLAWED
Waging preventive, illegal wars won’t deter any candidates for quick WMD acquisition programme. On the contrary, they are accelarating & multiplying their efforts as the US is madly stuck in the Iraqi quagmire. The race for time is their major asset.
POORLY IMPLEMENTED
Bush –however late US awareness proved to be- did launch his counterterrorism “crusade” (sic) with the hope to eradicate islamofascism presence from the whole World. He got some results in Pakistan but completely failed to stop asymmetric terror (Israel, Iraq, Indonesia, Saudi Arabia, India & Morocco bombings). It’s a bit like the David vs Goliath story: islamofascists need low technology & few weaponry to inflict devastating damage as their main resource is determination, astuteness & total lack of humaneness. They’re merely aping ancient Barbarians methods (sack of Rome) or the English archers thrashing French chivalry (Azincourt – 1415) or getting inspiration from the outcome of the Boxer war.
The USA is too heavily relying on technology to win the battle: data is acquired through satellites or drones performing space or air reconnaissance or surveillance. Oussama & Co know that & they utilise US overconfidence to flood the Afghanistan-based US army back with copious fake information. Saddamite terrorists do just the same in Iraq. The US intelligence would be well inspired to multilaterise their approach & resort to the experience gained by countries still operating human intelligence, not just pointless flying computers. European secret services have been more successful in arresting malicious islamofascists.
Another US technological myth is biometry. How can a dormant islamofascist be detected by a biometric device that’s bound to track known criminals only & that will thus grant you no immunity against false acceptance? If you just take heed about what your simiesque computer want you to be aware of, then you’re warranted great disenchantment. Biometry just can’t measure up to classical human percolation managed by competent European intelligence.
> I believe the military costs (SO FAR) in Iraq are
> something like $20 billion with another $5 billion
> in humanitarian aid. Not counting the asked for
> $78 billion in future costs for rebuilding, aid and
> occupation over the next two years. – Asked for
> being the key words there
> When you start including foreign aid to Albania,
> Bosnia, Serbia, Croatia and the rest of Eastern
> Europe. The “asked for” totals in Iraq and the
> REAL totals of Kosovo start to look remarkably
> similar.
Um, the total cost of the Iraq war + occupation will be several hundred billion $’s, virtually all of which be paid for by American taxpayers since the President was smart enough to p*ss off the rest of the world before going it alone. That is a very major difference compared to Gulf War I and Kosovo, which were largely paid for by other Arab states and Europe, respectively.
> As far as US casualties in
> Kosovo/Bosnia/Serbia… Something like 150
> (including accidents) VS 320 (including accidents)
> in Iraq.
“Including accidents?” Well, excluding accidents, the Kosovo total is close to zero.
MARCU$
Dale, i see article got cited in the WSJ today. Well done.
Kodiak, it is waaaaay too early to call the Iraq venture a failure. I doubt it. One thing for sure, we won’t want any French folk queering up the picture when Iraq becomes a fully peaceful country
Jonathan,
(…)we won’t want any French folk (…)
You don’t have to want anything. Iraq is NOT your country, you are NOT entitle to do anything in this country, the US plans for Iraq are of NO 1/ interest – 2/ legitimity – 3/ accuracy.
All you have to do about Iraq is knock it off NOW !
And it is waaaaay too late for you to stick that into your heads once for good.
Johnatan,
Kodiak wants Saddam back in a hurry. He and Chirac just love Saddam.
Please answer this one question.
Why are we still in Germany? WWII ended in 1945 and the”cold war” was declared over when the Berlin wall came down. Germany is now a united country and our “ally”.
Jacob,
Your bullshit-per-minute rate has just increased beyond reasonable imagination.
Congrats for that.
I’m sure you can make it explode so hard it will be heard even in Iraq.
Bill Johnson,
Excellent question !
Answer from the Bushist myth factory
You know, the Germans are so primitive they need being shown how to organise elections. And Bavarians could slaughter Low-Saxons with the perfidious help of the Thuringese. Not to mention those filthy protestants (the West Hamburg faction): they are infiltrating the catholic minority from Northern Palatinate. Well, that’s the latest news I just got from FoxNews…
Oh, I didn’t even notice the link in the post, actually.
The reason I pointed out that site is because this graph doesn’t seem to present the data that I see there accurately. Maybe its the scale you used or something.
Ah, I see another reason I didn’t think you used the site I mentioned… You wrote “I’ve been tracking the results on a day by day basis ever since.” That implies to me that the graph was based on personal data you had collected.
Anthony makes a good point. Deception with statistics, deception with words. Looks like stock and trade around these parts.
The reason he doesn’t show a cumulative chart is because it contradicts his analysis. This URL allows you to look at the other side of the coin.
http://www.ac.wwu.edu/~stephan/USfatalities.html
(And yes if you only at that chart you are only seeing half the picture)
Or check this out:
http://lunaville.org/warcasualties/WndByDate.aspx
93 soldiers wounded in hostile attacks in one seven day period (9/22 – 9/29).
Going quite swimmingly I’d say.
The chart looks worthless to me. Counting only deaths, not woundings or attacks, means the number of incidents per month is so small that random chance can’t help but play a big role in the trajectory of the line. If a few more bullets a month hit (or miss) their targets, the chart changes dramatically. And of course there’s a lot more to the “resistance” than just killing coalition troops– things like assassinating governing council members, UN personnel and Shiite clerics. Those don’t show up in the graph, but they certainly seem significant.
Here’s what one commentator has to say about the “tailing-off” of the resistance:
“The enemy has evolved — a little bit more lethal, a little more complex, a little more sophisticated, and in some cases, a little bit more tenacious.”
That’s General Sanchez talking in today’s Washington Post. Maybe he hasn’t seen this chart.
Seriously, to me the chart looks like armchair analysis at its finest. Any resemblance between it and reality is probably entirely coincidental.
Sorry Kodiak that I have to point out the logical consequences of your positions:
1. No war on Iraq = Saddam stays in power, the oil contracts with Elf are on, and so are the atrocities commited by S.
2. “All you have to do about Iraq is knock it off NOW !” = Saddam gets back in power = Elf contracts and atrocities again on.
Maybe you are not so much concerned with those contracts as Chirac, so you must be in love with Saddam for the atrocities.
Chirac gets the benefit of doubt – it is not aplatonic love for Saddam and his atrocities but rather those Elf contracts that he cares for.
Anthony: Yes, I was checking the site you mention and updating my graph based on their monthly breakout on a daily basis up until two days ago. I’ve been too busy to look at it since. You will find that the black line matches their monthly total; and hostile+nonhostile=total.
It’s the simplest possible graph to make and gives more real trend information f(t) than graphing Integral(f(t), ie the cumulative. There may be an assymptote to the Integral if it fits a curve like (1-e^t), which would be interesting, but I’ve not got the time to do anything fancy.
It really takes a moron to ascribe motive to a choice of graphing when the choice is the dead obvious one. You have a time series of data (the quoted site) so… you plot a time series graph. Simple as that.
If the complainers want more complex analysis, they can get out their calculus book and do it themselves. If they expect a thesis with multiple charts and graphs and every possible permutation of data charting, they can do it themselves.
Perhaps they have time on their hands and don’t need to worry about whether they can afford spaghetti and canned tuna next week.
Actually, there’s nothing wrong with using statistics in war, so long as they’re used correctly. Operations research is the classic example–the field came into its own in WWII and greatly helped the U-boat war, the air war, and logistics.
You can use quantitative methods quite validly in a number of ways, including evaluating the effectiveness of tactics or in efficiently deploying resources. It’s not a substitute for strategy, though.
In this case, the statistics _can_ be valid if you make some assumptions, some of which have already been touched on. For example, that the US forces are still conducting operations at basically the same tempo and the same way, that the attackers haven’t radically changed tactics and are still trying to do the same things in the same way, etc.
JakeV! Marvelous! I can’t wait to relish your commentary in the months ahead as this chart evolves. Every faint uptick will no doubt be considered conclusive evidence of disaster in the wings, while every downward trend will be just a statistical anomaly.
Quite an interesting graph.
But don’t expect to find this in any of the liberal newspapers in America. They report Iraq as if 200 men a week were dying, as in Vietnam.
Jacob,
What’s this tedious, worn-out obsession with Elf? Can’t you just find another three-letter word to annonate your Bushist mantra ?
Since you seem to love logics, here’s a bit for you:
1. No war on Iraq = no Iraqi kid is slaughtered = islamofascist plague stays out of Iraq = the USA is not considered the worst rogue State of the World = Halliburton is not vampirising Iraqi property to finance Bush’s (first) election in 2004
2. “All you have to do about Iraq is knock it off NOW !” = UN handle fast, efficient, transition to Iraqi self-ownership = the Arabomuslim galaxy understands the West is not there to humiliate them & steal their oil
I think YOU are the one in love with Saddam, Rummy’s best friend (see: they’re always having a little fight before reconciliation & resuming WMD dealing). Perhaps you also had une affaire de coeur with George Ben Laden , you know, Oussama Ben Bush’s best friend…
I’m sure this graph will be a great comfort to the families of those who have been killed and wounded.
There are three kinds of lies: lies, damn lies, and statistics.
And no, I don’t love Saddam 😉
I hope you’re right. Ironic that in today’s paper General Sanchez says the opposition is getting smarter….
i m doing bsc maths.i m from pakistan.i want to
addmission in law department of linkin university
plz tell me its requirements
Kodiak
“UN handle fast, efficient, transition to Iraqi self-ownership ”
That was a good joke ! Ha, Ha Ha !
> If the complainers want more complex analysis,
> they can get out their calculus book and do it
> themselves.
Dale, I do think it’s an interesting and well-made graph. It’s just very difficult to draw any sort of conclusion (optimistic or pessimistic) from the data, which really only presents past history. To predict the future, you would need to know things like the number of people responsible for the killings, the level of support they receive from Iraqi non-combatants and other Islamic nations, the motives that make the guerilla fighters “tick” (islamic fanaticism? loyalty toward the Baath party/Saddam? criminal activities? clan members avenging the deaths of relatives?), how skilled they are or even where they come from. It seems nobody really knows the answers to these questions. Even the Bush Administration itself probably doesn’t have a good picture, although they should have access to much more data than we do.
MARCU$
It’d be neat if someone measured the number of Saudi jihadis and Saddamites have been killed/captured. That’d give a sense of who is suffering a quagmire.
> It’d be neat if someone measured the number of
> Saudi jihadis and Saddamites have been
> killed/captured. That’d give a sense of who is
> suffering a quagmire.
100% irrelevant. What matters is how each side copes with military losses and its impact on morale.
MARCU$
Jacob,
That was a good joke ! Ha, Ha Ha !
Do you this French music-hall song from the early XXth century: Tout va très bien, Madame la Marquise! ?
It’s the very song you & your Bushist pathetic acolytes are singing while your neocons house is burning & while the image of the USA (not to mention its credibility) is blurred (to remain polite & fair).
Is it blindness, autism, nostalgia or foolishness?
I’ll ask your Texan marquise…
Reid-I don’t think the occupation is a disaster. Notice I referred to the small number of overall deaths. I have never trumpeted the attacks on coalition forces as evidence of deep trouble for the occupation, as I recognize that they are a small part of the overall picture, a picture to which I have very limited access.
I was just pointing out that this graph tells us nothing, or next to nothing, about how the occupation is going. And since it tells us so little, its main effect is to give a pseudo-objective, pseudo-scientific aura to a largely unsupported conclusion, which I think is deceptive. Look at Dale’s Heinlein quote– he’s suggesting that his results are “science.” I don’t think so, for the reasons I mentioned above.
I guess if Dale had called his post “a funny little graph I made” instead of “we’re winning,” I wouldn’t have minded as much. But instead he (and many commentators) were using this graph draw conclusions about the occupation which the graph in no way justifies. That’s pseudo-science, and I think that when pseudo-science dresses up as real science, it should be criticized.
Don’t you?
JakeV,
Well said !
Kodiak
“UN handle fast, efficient, transition to Iraqi self-ownership ”
The Texan Mrquise’s house may be burning or not, but what is funny is your belief that the UN is capable of handling anything, let alone handling it “fast and efficient”.
I think the original analysis presented is fairly simple-minded. I would have liked to have seen a 30-day running average as opposed to calendar months used (might have smoothed out the bumps; also, discrete ~30-day periods called “months” really have no meaning in this type of analysis). Also, I agree with those who say that the “major-combat-operations” phase of the war should be excluded from the analysis; we would expect there to be a difference pre- and post-“Mission Accomplished” and the data presented here (imperfect as it may be) leads me to think that we’d find a statistically significant difference between the periods. This is fine and dandy (and nice for those troops now stationed in Iraq) but doesn’t inform the discussion on the post-“Mission Accomplished” death rate, which seems to be the point of Dale Amon’s original post.
I think a simple regression analysis done on a data set based on the moving average would be much more informative than what’s presented here. Much of the commentary generated here (and off-site) is based on people’s political views instead of their statistical knowledge.
JakeV – I think it would be easy to read too much into the graph. However, the rate of deaths has been declining significantly for two months straight by more than 30% from the peak. That is not statistically meaningless.
My point is that I have little doubt that, were the curve to be inverted, your interpretation of the usefulness of the graph would be markedly different.
JakeV: I have to agree with Kodiak on this, “Well said.”
Reid: If the curve were to be inverted, my interpretation of the usefulness of the graph would be the same. It is useful and interesting but it doesn’t prove anything. It supports any number of underlying explanations, and what matters is which of those explanations are correct (cf. the global warming debates).
I think this would have been a perfect post if Dale had named it something like, “An interesting graph” and included Mark Twain’s observation on numbers and science from “Life on the Mississippi” (1884):
In the space of one hundred and seventy six years the Lower Mississippi has shortened itself two hundred and forty-two miles. That is an average of a trifle over a mile and a third per year. Therefore, any calm person, who is not blind or idiotic, can see that in the Old Oölitic Silurian Period, just a million years ago next November, the Lower Mississippi was upwards of one million three hundred thousand miles long, and stuck out over the Gulf of Mexico like a fishing-pole. And by the same token any person can see that seven hundred and forty-two years from now the Lower Mississippi will be only a mile and three-quarters long, and Cairo [Illinois] and New Orleans will have joined their streets together and be plodding comfortably along under a single mayor and a mutual board of aldermen. There is something fascinating about science. One gets such wholesale returns of conjecture out of such a trifling investment of fact.
Hi Dale –
The October causality rate would appear to falsify your hypothesis. Time for a re-analysis?
Using the Lunaville stats, and counting only US fatalities, I get a different-looking graph. See the first of the graphs at:
http://www.lies.com/blog/archives/001316.html
A big part of the difference in our two sets of numbers appears to be that the British had a bunch of casualties in the first month of the war, with their fatalities declining dramatically after that.
But I agree with the previous commenter. Your willingness to post objective data in graphic form is to your credit. To live up to that same standard now, though, would require you to post an updated version of the graph, and acknowledge that the earlier “rather striking” clarity you spoke of has turned out, in hindsight, to be at least somewhat murkier.
Please update your casualty graph.
Thank you.
Roland
I would like to see the above graph simply updated to show October figures. I fear it would not look good–though, as I said above, it would no more prove “we are losing” than the March to September graph proved “we are winning.”
I just came upon a graph of recent figures that, by the end points it uses, makes it look like things are really going to hell. I don’t think the maker meant it that way and that’s not the message he draws from it.
http://members.cox.net/mroetto/kia.gif
Let’s see:
October: 45 casualties
November (as of 15th): 81 casualties
This is quite the reverse of a tail-off. At this rate, November will be the worst month for Coalition casualties since the war began. I think Dale’s original analysis suffered from a fault that has been prevalent in much of the analysis connected with this war: over-optimistic interpretation of ambiguous or questionable data.
I have a simple column graph with data through this morning at
http://www.ac.wwu.edu/~stephan/USmonthly.gif
This is a column graph, appropriate for this sort of data. It is inaccurate in that the “months” of Mar and Nov are only partial (to turn this into a proper histogram you’d have to make the values equal to the areas of the bars – i.e., nearly double the value for Nov).
I just realized I could probably post that graph right here.
We are losing!
Striking in its clarity, isn’t it?
lies.com seems to be doing a monthly update of a casualties graph. The one through January 2004 can be found at:
http://www.lies.com/blog/archives/2004_02.html
Dale had 7 data points and the first 7 data plots on the lies.com graph look much like Dale’s. Alas, the other 4 are all higher than the last two months of Dale’s.
I would expect lies.com to have an update with February figures around March 4.
A graph with February figures can be found at
http://www.lies.com/blog/archives/001529.html
February was actually the best month of the 12 so far.
A graph for the first 13 months (March 2003-March 2004) is at:
http://www.lies.com/blog/archives/001564.html
The first 14 months now, graphed at:
http://www.lies.com/blog/archives/001621.html
The last month had by far the highest casualty figures of any month so the graph seems to say, “We are losing.”
I don’t think that’s actually true. I suspect that casualty figures will go down considerably in the months ahead. But only more data will tell if I’m right or wrong.
Well, May was a lot better than April, but still the third worst month. Graph for all 15 months at:
http://www.lies.com/wp/2004/06/01/us-war-dead-in-iraq-for-may/
Deaths down again in June, though still above several months. 16 month graph at
http://www.lies.com/wp/2004/07/05/us-iraq-deaths-down-in-june/
Deaths up slightly in July. All 17 months so far at:
http://www.lies.com/wp/2004/08/02/us-soldiers-continue-to-die-in-iraq/
Deaths up slightly in July. All 17 months so far graphed at:
http://www.lies.com/wp/2004/08/02/us-soldiers-continue-to-die-in-iraq/
Dale –
Your original analysis has proved to be famously wrong! I wonder, what do you make of the trends in the data now? Looking at the graphs of this site, it seems to be that the insurgency has been progressively stepping up this year. This seems worthy of comment.
Eighteen months now graphed at:
http://www.lies.com/wp/2004/09/03/eighteen-months-in/
August’s deaths are up from July’s (they are the 4th highest month so far). If you take out the first two months, which were the initial invasion and mopping up. there is a slight upward trend.
Concentrating on military only deaths is pathetic. The total death rate is going UP.
Also, you are only counting individual numbers now how those numbers compare to the total remaining troops.
Our ‘Troops’ are murdering innocent people every day.
19 months graphed at
http://www.lies.com/wp/2004/10/01/another-months-progress/
Well it seems a shame that you should declare we are winning on the basis of a few months data at the start of the war, and then just ignore all the evidence since. Here is a regularly updated graphical representation of military casualties.
http://www.ac.wwu.edu/~stephan/USfatalities.html
Pity is that it doesn’t also show civilian deaths, but seemingly they don’t matter; certainly the coalition can’t be bothered to count them.
“Perhaps sometime next sumer I should come back to this and toss in the face of certain folks… but they’ll all be off on a different “failure” by then.”
Posted by Dale Amon at October 2, 2003 09:20 AM
——————-
We are waiting…..
Since you missed the election news, you might want to catch up on it:
http://www.opinionjournal.com/extra/?id=110006229
A graph going through January, 2005, the month of the election, can be found at
http://www.lies.com/wp/2005/02/18/january-deaths/
It doesn’t look real good, with an uptick in deaths for the months before the election. Now, we know that the Saddamites and jihadis were trying to make the election a failure, and increased their attacks. The graph indicates that they were able to kill more people, though they were not able to stop the election or keep many people from voting outside the Sunni areas.
Will the election mark the beginning of a long downward trend?
Post-election (February) deaths are down, though still higher than in many of preceeding 24 months. Has it really been a full two years? Graph at:
http://www.lies.com/wp/2005/03/05/february-deaths/
US deaths way down in March. Is this a false spring (like months 9-12) or light at the end of the tunnel (to mix metaphors/cliches)? Graph at:
http://www.lies.com/wp/2005/04/10/us-iraq-war-deaths-down-in-march/
Slight uptick in April, though still lowest in last 10 months. Graph of all 26 months at:
http://www.lies.com/wp/2005/05/06/us-iraq-war-deaths-for-april/
May deaths up. Sigh
http://www.lies.com/wp/2005/06/01/iraq-war-deaths-for-may-2005/
June 2005 deaths about the same as May. Graph at:
http://www.lies.com/wp/2005/07/08/iraq-war-dead-for-june-2005/
Roger man, let me help you “stay the course”! Here are the latest casualty figures.
http://www.lies.com/wp/2003/10/20/us-deaths-in-vietnam-and-iraq-by-month/
“It’s not a quagmire!”
Two years later, and we’re still winning the war,
turning corners and crossing major pivot points
about 3 times a year. There is no insurgency.
Just some dead enders. Stay the course.
No choice but total victory in the war on terrorism, er,
global extremism. We won’t cut and run. Our
departure would dishonor the the troops that have
been killed and wounded. We’re fighting them there
so we won’t have to fight them here.